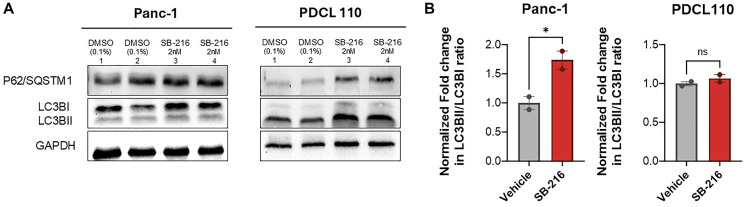
Figure 4.SB-216 induces autophagy in pancreatic cancer cells(A) Protein expression was evaluated with western blot (n = 2), GAPDH was used as the loading control. Panc-1 and PDCL 110 cells were treated for 48 hours with SB-216 (2 nM) or DMSO (Control). (B) A quantitative assessment of protein intensity was performed using ImageJ software. Graphs represent fold change in LC3BII band intensity relative to LC3BI, normalized to GAPDH band intensity. (Values mean ± SEM, n = 2, *p < 0.05).